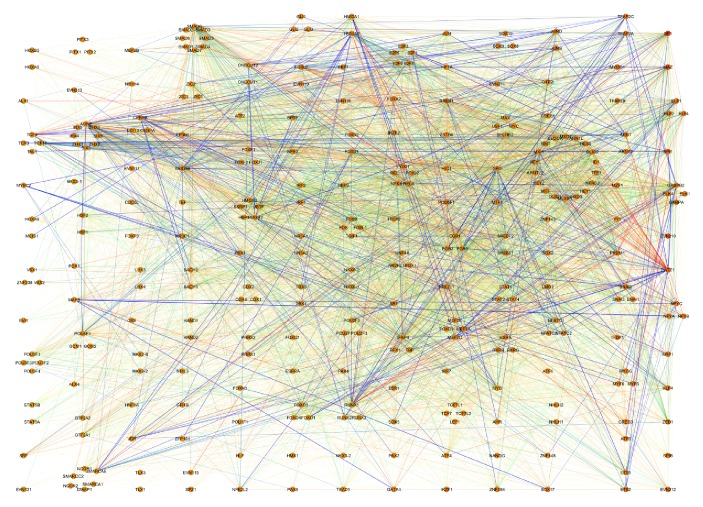
Figure 5.
Transcription factor subnetwork. In this graph, the 298 TFs of the FANTOM4 network are depicted. Genes are sorted according to the gene out-degree (top left-to-bottom right); set of nodes describing a circle has the same out-degree. The color code of links is the same as in Figure 2.

