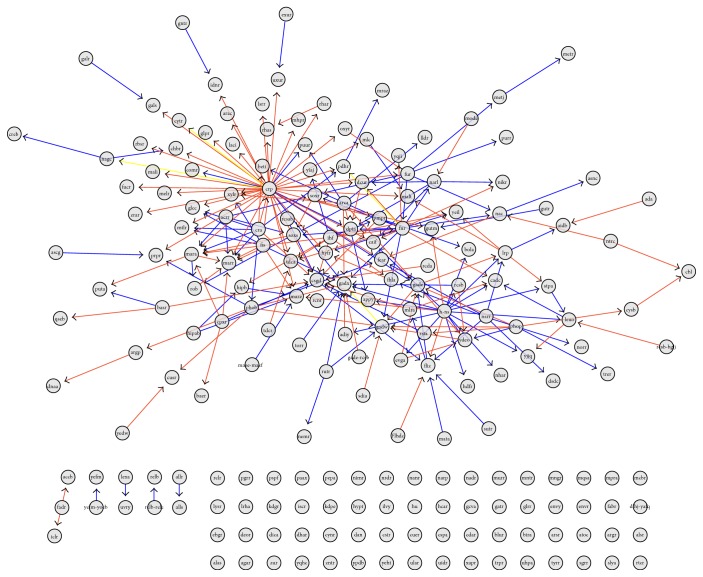
Figure 6.
Transcription factor subnetwork. In this graph, the 203 TFs of the E. coli RegulonDB network are depicted. The color code of links is the same as that in Figure 4. As it was observed in the whole network, in this TF subnetwork, some disconnected components appear.

