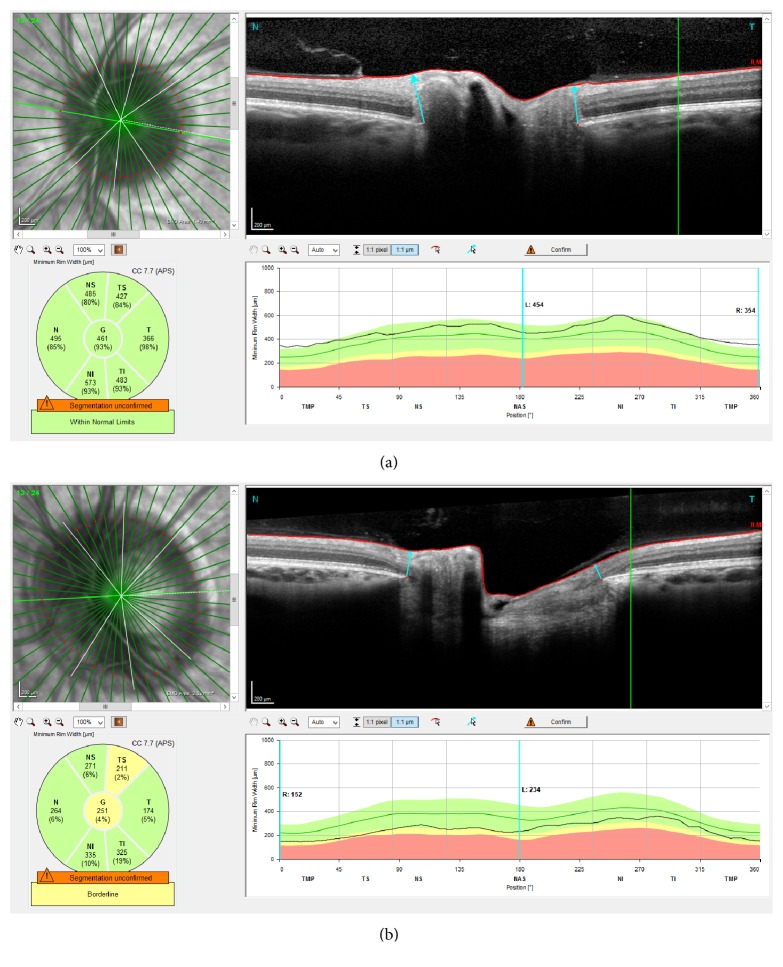
Figure 2.
A sample demonstration of two representative SPECTRALIS SD-OCT BMO-MRW examinations. The upper left image shows the cSLO image of the ONH with red-marked borders of the perimeter as established by the BMO and green lines indicating the acquired SD-OCT scans. The right image shows one SD-OCT scan with a marked BMO (small red dot) and the BMO-MRW (cyan arrow). The lower left schematic shows the mean BMO-MRW for the individual sectors and the lower right schematic shows the distribution of the BMO-MRW over 360° of the ONH. The black line indicates the actual measurement while the colors (green: within normal borders, yellow: borderline, red: outside normal borders) represent the underlying normative values. Image (a) shows a small ONH with an area of 1.40 mm2 and a manually measured perimeter of 4244.2 μm. The BMO-MRW is in the upper range of the manufacturer-provided normative values. Image (b) shows a large ONH with an area of 2.33 mm2 and a perimeter of 5454.9 μm; the BMO-MRW is in the lower range of the normative values.

