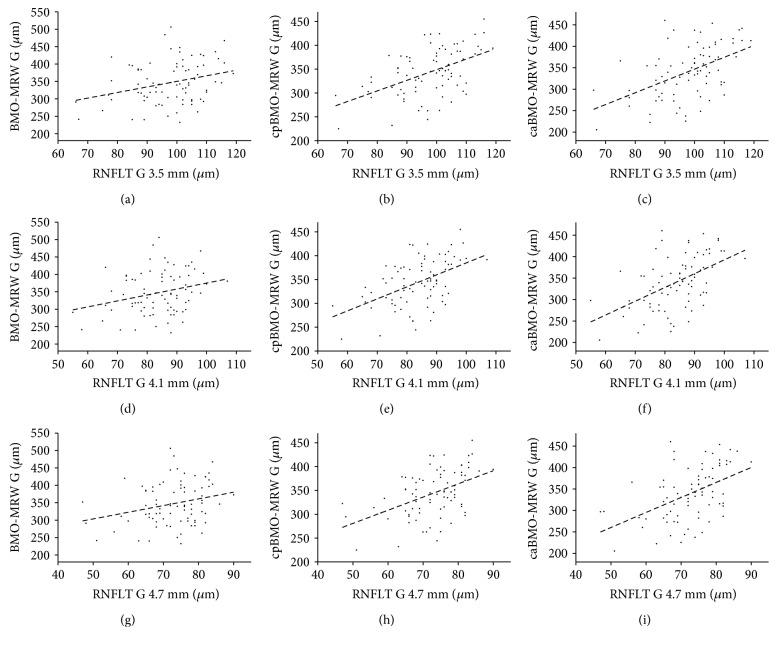
Figure 4.
Correlations with linear regressions are shown of the mean 3.5 mm diameter global RNFLT with the mean global BMO-MRW (r = 0.292; p = 0.009 (a)), the mean global perimeter-based corrected BMO-MRW (r = 0.501; p < 0.0001 (b)), the mean global area-based corrected BMO-MRW (r = 0.502; p < 0.0001 (c)); the correlation of the mean 4.1 mm diameter global RNFLT with the mean global BMO-MRW (r = 0.272; p = 0.014 (d)), the mean global perimeter-based corrected BMO-MRW (r = 0.496; p < 0.0001 (e)), the mean global area-based corrected BMO-MRW (r = 0.514; p < 0.0001 (f)), the correlation of the mean 4.7 mm diameter global RNFLT with the mean global BMO-MRW (r = 0.265; p = 0.017 (g)), the mean global perimeter-based corrected BMO-MRW (r = 0.473; p < 0.0001 (h)), and the mean global area-based corrected BMO-MRW (r = 0.486; p < 0.0001 (i)).

