
Figure 1. Cumulative incidence curves for incident ESRD by (A) percent-predicted FVC and (B) FEV1/FVC.
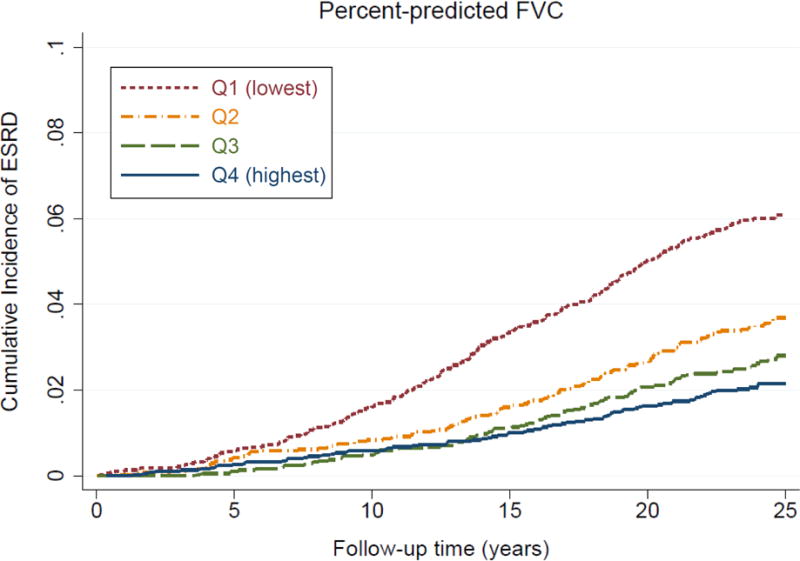
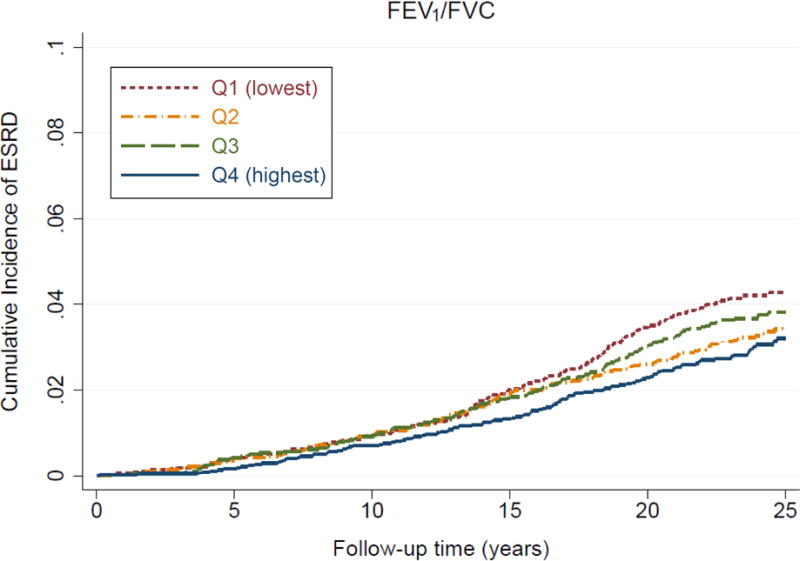
The thresholds of quartiles (%) are as follows: white men, 90.1, 98.9, and 108.0; white women, 95.1, 105.0, and 114.4; black men, 85.3, 94.9, and 103.8; and black women, 89.1, 99.5, and 110.1, for percent-predicted FVC; white men, 68.6, 74.0, and 78.2; white women, 71.5, 75.7, and 79.3; black men, 70.9, 76.5, and 80.7; and black women, 73.8, 78.5, and 82.0, for FEV1/FVC.
Abbreviations: ESRD, end-stage renal disease; FEV1, forced expiratory volume in 1 second of expiration; FVC, forced vital capacity