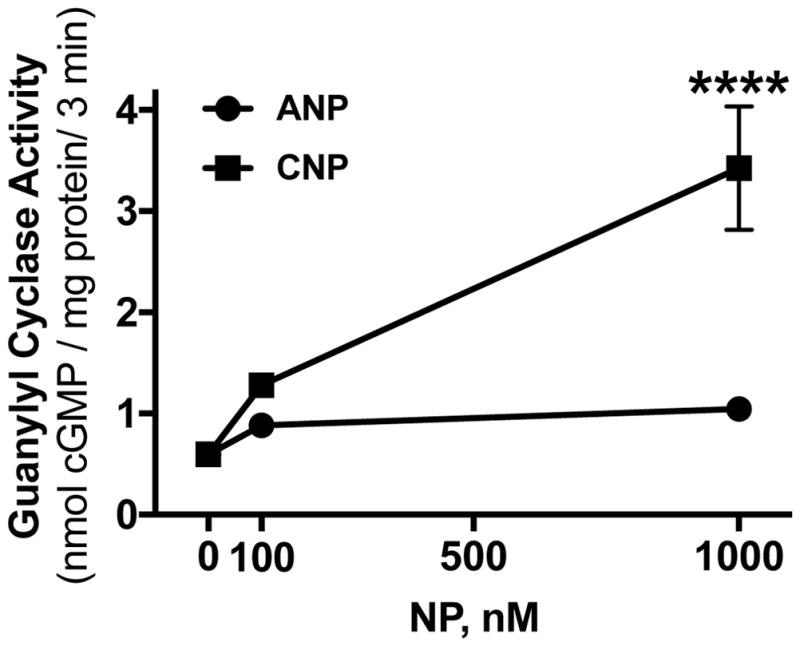
Figure 1. RCS cells express GC-B.

Crude membranes from RCS cells were assayed for GC activity with 1 mM ATP in the presence of 100 nM or 1000 nM concentrations of ANP or CNP as indicated. Each point represents the average of duplicate determinations from 3 separate experiments such that n=3 for each point. Symbols represent the mean and the vertical bars represent the standard error. Where error bars are not visible, they are contained within the symbol. **** indicates p<0.0001, using an unpaired, two-tailed student’s t-test.
