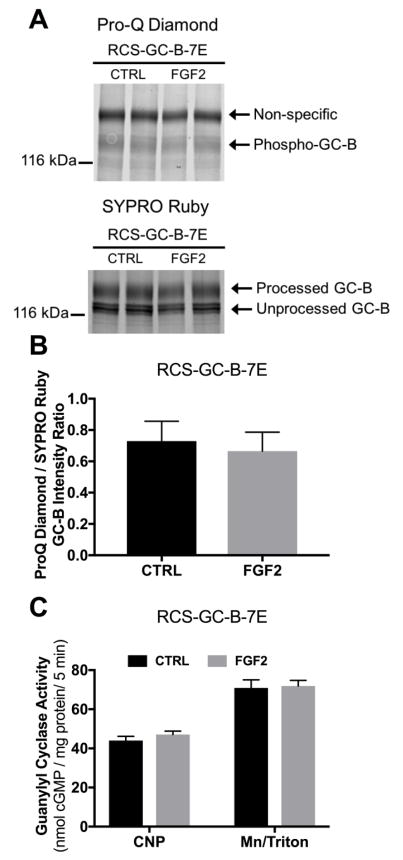
Figure 6. FGF2-dependent GC-B inhibition requires changes in the known GC-B phosphorylation sites.
RCS cells were transduced with adenovirus expressing GC-B-7E. Cells were treated with 1 μg/ml heparin with or without 100 ng FGF2 for 20 min. (A) Pro-Q Diamond phosphate staining followed by SYPRO Ruby protein staining of immunoprecipitated GC-B-7E fractionated by SDS-PAGE from one of the sets of membranes assayed for GC activity. The arrow labelled Phospho-GC-B marks the position of phospho-GC-B on gels of wild type GC-B (Fig. 6A); the faint band could represent either staining of glutamate (32) or unidentified GC-B phosphorylation sites that were not mutated to glutamate. The exposure for this image was increased relative to that for Fig. 5A, in order to show the faint band. Correspondingly, the non-specific band is darker in 6A vs 5A. (B) Densitometry measurements of the ratio of intensities of the phospho-GC-B (ProQ) and total processed GC-B (SYPRO) bands. (C) CNP- or detergent-dependent GC activity measurements for the same membranes that were used for the ProQ Diamond and SYPRO Ruby measurements from (B) (results are from 8 determinations that came from 4 independent experiments).

