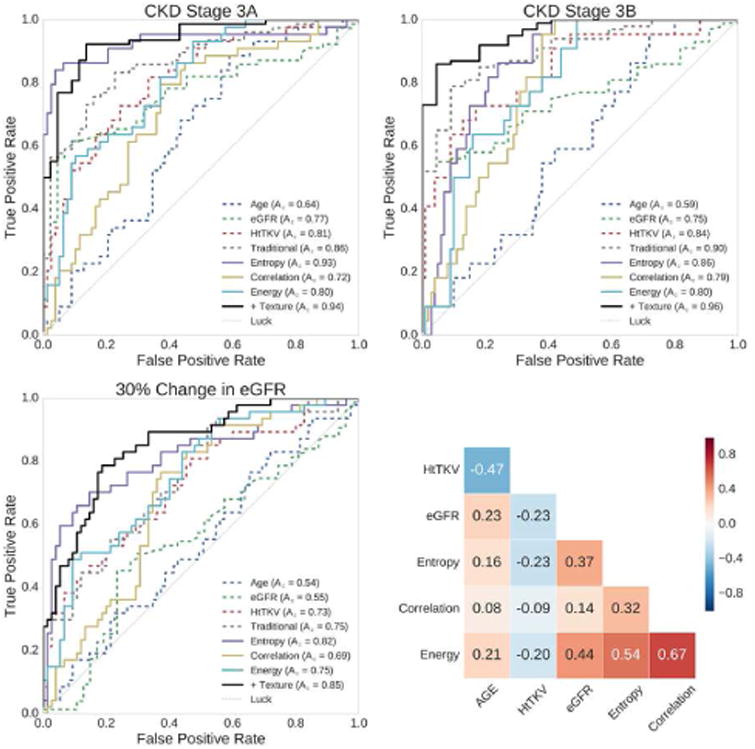
Figure 4.

Individual biomarkers show strong predictive power for progression to CKD stage 3A, CKD stage 3B, and 30% change in eGFR in 8-year follow-up exams. Shown in the top left panel are the ROC curves for prediction to progression of CKD stage 3A, in the top right are the ROC curves for prediction of progression to CKD stage 3B, and in the bottom left are the ROC curves for prediction of a 30% or more decrease in eGFR. The individual biomarkers include age, eGFR, HtTKV, Entropy, Correlation, and Energy. In the bottom right is the correlation matrix showing how the individual features relate to one another. These biomarkers were included in a multiple linear regression model in order to ascertain the added value over traditional image derived modeling. The traditional model (‘Traditional’) used age, eGFR, and HtTKV, while the texture model (‘+ Texture’) also included Entropy, Correlation, and Energy. Compared with the traditional model, the addition of texture improved the predictive power to CKD stage 3A from an Az of 0.86 to an Az of 0.94, to CKD stage 3B from an Az of 0.90 to an Az of 0.96, and for a 30% or more change in eGFR from an Az of 0.75 to an Az of 0.85. Coloring in ROC curves corresponds to colors in Figures 5 and 6, and dashed biomarkers are ‘Traditional’, whereas solid lines are texture based.
