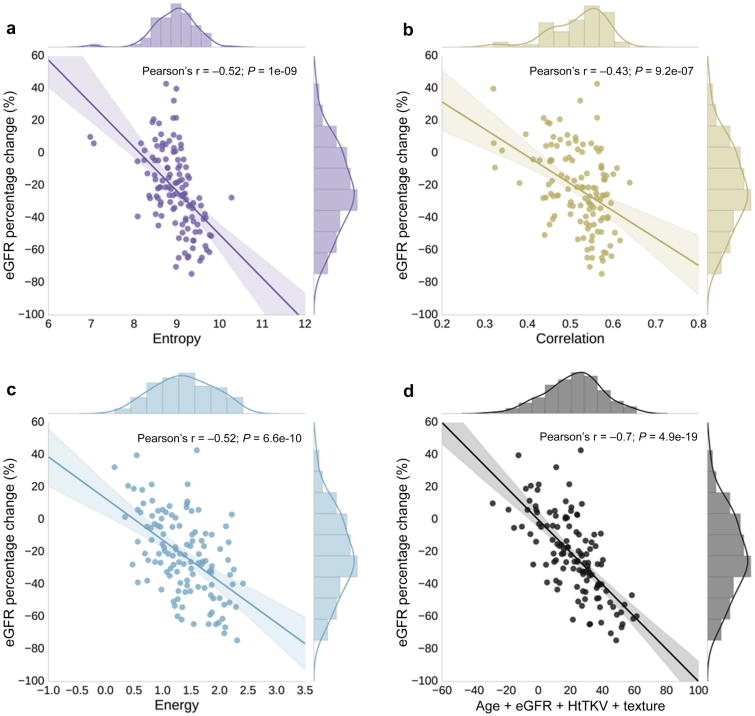
Figure 6.
Individual texture biomarkers showed strong correlation with subsequent percent change in eGFR. Shown here are the regression analyses results, comparing texture biomarkers (Entropy, Correlation, and Energy) to percent change in eGFR at 8 year follow up. Shown in the bottom right panel is the multiple linear regression model incorporating traditional biomarkers and texture features. This multiple linear regression model incorporating image texture features helped further refine prediction of subsequent renal function decline improving Pearson's r from -0.51 (traditional biomarkers alone, bottom right panel of Figure 5) to -0.70 (addition of image texture features). Coloring corresponds to those used for each feature in Figure 4.

