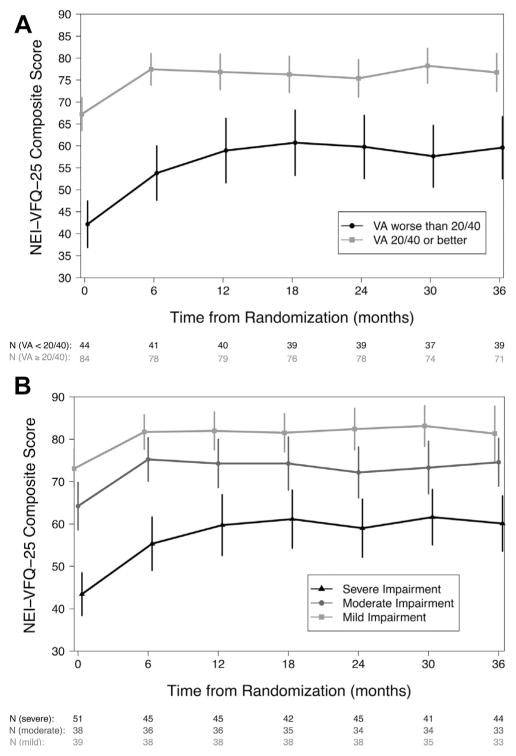
Figure 2.
The relationship between the 25-item National Eye Institute Visual Functioning Questionnaire (NEI-VFQ-25) composite score and visual function, measured by (A) visual acuity (VA) and (B) visual field mean deviation, over the first 3 years after randomization for eyes assigned to implant therapy. Visual acuity is categorized as 20/40 or better (grey line, square) or worse than 20/40 (black line, circle), and visual field mean deviation is categorized as mild impairment (>−3 dB; light grey line, square), moderate impairment (−3 to −6 dB; grey line, circle), or severe impairment (<−6 dB; black line, triangle). The estimated means with 95% confidence intervals are plotted for each category.

