
Figure 1. Proteomic screens of chemokines in plasma and blister fluids of EB-affected patients.
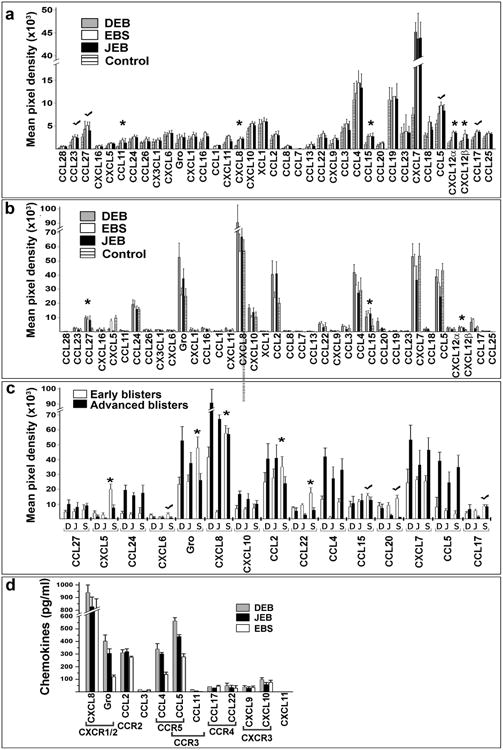
(a-c) Antibody array analysis of the chemokines in plasma (a) and blister fluids (b, c) of EB affected patients. Asterisks indicate chemokines which levels are significantly different (p<0.05) in EB samples relative to control. Check marks indicate consistently high chemokines. Panel a - blood plasma from healthy donors was used as a control. Panel (b) - blister fluids from frost bite-and burn-induced blisters of healthy donors was used as a control. The data was collected from independent arrays with duplicate measurements for each chemokine using all samples listed in Table S1. Data are presented as a mean pixel density ± SD. EB types are indicated in the inserts. (c) Comparison of the selected chemotactic molecules in early and advanced blisters of EB patients. EB forms (DEB (D), JEB (J) and EBS (S)) and chemokines are listed below the columns. (d) Multi-Analyte ELISA analysis of common human chemokines in selected DEB (n=18), JEB (n=6) and EBS (n=6) BF samples. The values are presented as the mean chemokine concentration (pg/ml) ± SD. Detected chemokines and their cognate receptors are shown below the columns.