
Figure 4.
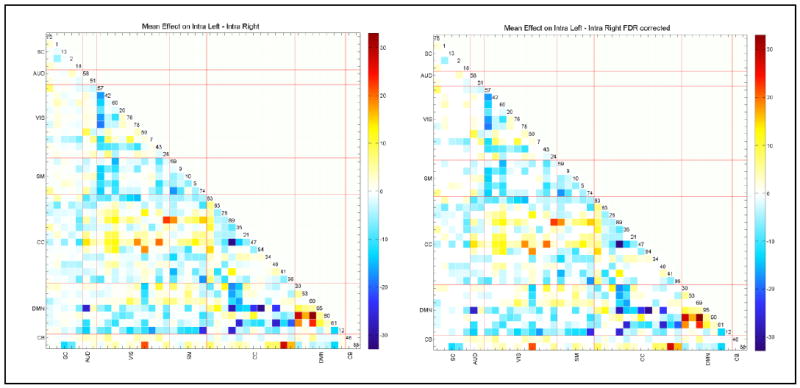
Paired t-test (L_FNC minus R_FNC) results in – log10(p-value)*sign(beta) format to compare left and right FNC on the left, and after 0.05 levels FDR correction on the right. A lot of networks pairs exhibit significant differences, mostly suggesting right hemisphere having more connectivity strength.