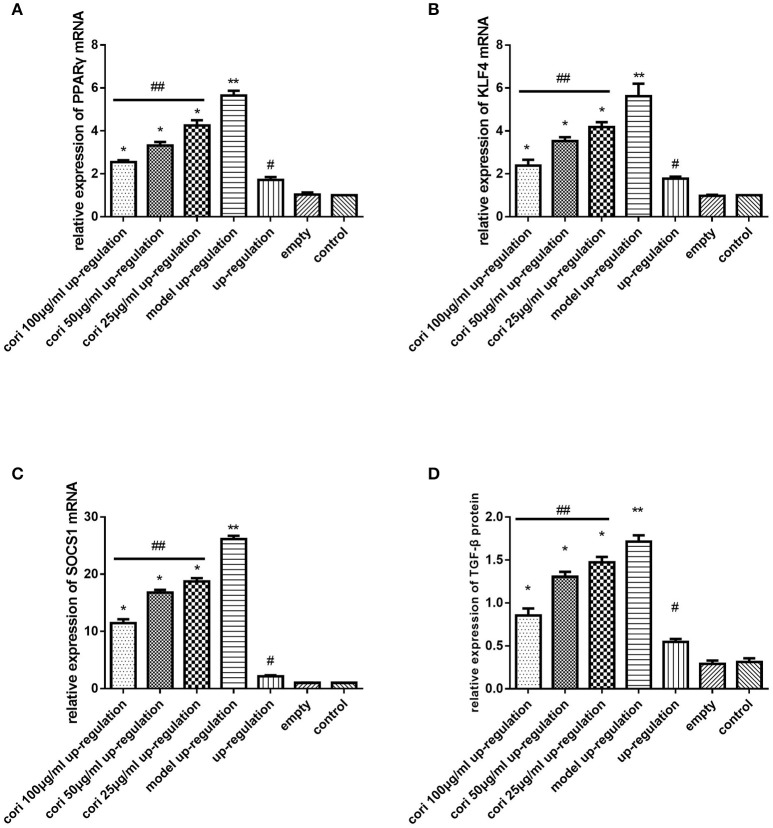
Figure 6.
Effect of Corilagin on mRNA expression of PPARγ, KLF4, SOCS1, IL-13Rα1, STAT6 and protein expression of TGF-β after IL-13 stimulation in IL-13Rα1 up-regulated Ana-1 cells. Ana-1 cells was infected with IL-13Rα1 lentivirus or empty vector for 96 h except control group. Subsequently, the corilagin groups and model up-regulation group were administrated with rIL-13 for 24 h. Then the corilagin groups were treated with corilagin of different concentrations. Real-time qPCR and ELISA were performed. The dose-dependent anti-fibrogenesis effect of corilagin still persisted when IL-13Rα1 was up-regulated. (A) The PPARγ mRNA expression levels detected by real-time qPCR. *p < 0.01 compared with the model up-regulation group (n = 3, student's t-test); **p < 0.01 compared with the up-regulation group (n = 3, student's t-test); #p < 0.01 compared with the empty and control group (n = 3, student's t-test); ## p < 0.05 determined by one-way ANOVA and significant differences from the respective values determined by S-N-K method (n = 3). (B) The KLF4 mRNA expression levels detected by real-time qPCR. *p < 0.01 compared with the model up-regulation group (n = 3, student's t-test); **p < 0.01 compared with the up-regulation group (n = 3, student's t-test); #p < 0.01 compared with the empty and control group (n = 3, student's t-test); ##p < 0.05 determined by one-way ANOVA and significant differences from the respective values determined by S-N-K method (n = 3). (C) The SOCS1 mRNA expression levels detected by real-time qPCR. *p < 0.01 compared with the model up-regulation group (n = 3, student's t-test); **p < 0.01 compared with the up-regulation group (n = 3, student's t-test); #p < 0.01 compared with the empty and control group (n = 3, student's t-test); ##p < 0.05 determined by one-way ANOVA and significant differences from the respective values determined by S-N-K method (n = 3). (D) Effect of Corilagin on TGF-β protein expression detected by ELISA. *p < 0.01 compared with the model up-regulation group (n = 3, student's t-test); **p < 0.01 compared with the up-regulation group (n = 3, student's t-test); #p < 0.01 compared with the empty and control group (n = 3, student's t-test); ##p < 0.05 determined by one-way ANOVA and significant differences from the respective values determined by S-N-K method (n = 3). Data are shown with mean with SD.

