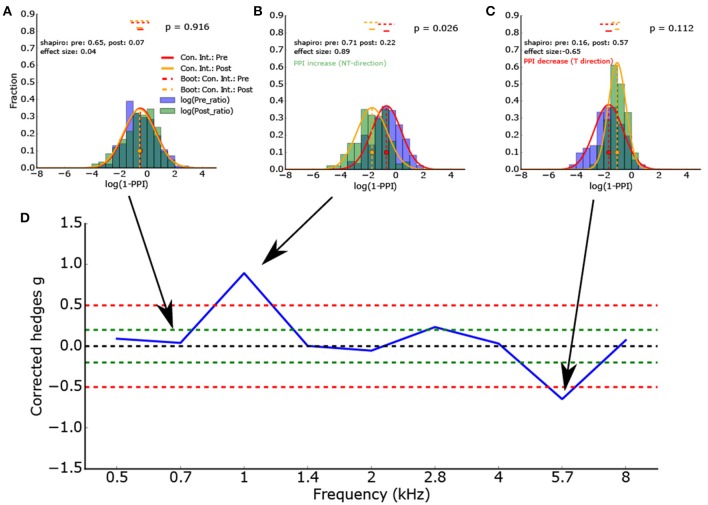
Figure 4.
(A–C) Histogram of the logarithmized ratios of gap and no-gap amplitudes (full combinatorial) for different center frequencies (0.7, 1.0, and 5.7 kHz) of the band noise presented. As the ASR amplitude ratios are almost lognormal distributed, the logarithmized values are Gaussian-like distributed. Application of the Shapiro-Wilk test proves that the normal distribution is a valid description of the data. The red and orange vertical lines show the full combinatorial 95% confidence intervals. The dashed vertical line show the 2.5–97.5% quantile of the means calculated via bootstrapping. The size of the bootstrapped data sets was the minimum of the number of peak-to peak amplitudes of gap and no-gap measurement. In other words the bootstrapped data sets provide the upper limit of the variance of the determined means (the confidence intervals). (D) To determine the PPI change, the corrected effect size is used (n1, n2 same sample size used for statistics). To test if the distributions differ significantly, inferential statistics were applied. However, as the ASR amplitude ratios arise from all combinations of gap and no-gap amplitudes, it is possible that the number of independent ASR amplitude ratios is overestimated.

