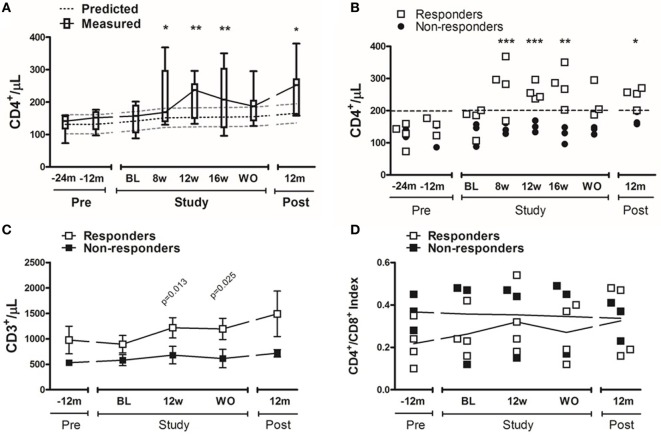
Figure 2.
CD4+ cell increase before, during, and after pyridostigmine (PDG). Total CD4+ cell counts were determined by flow cytometry as CD3+, CD4+, and CD8neg cells. (A) The solid line shows the dynamic increase of total CD4+ T-cells [median (p25–p75)] during PDG administration; for comparison, the broken lines depict predicted increase in circulating CD4+ cells of 35 cells/mL/year (4). (B) A subgroup of patients showed a significant, rapid, and persistent elevation in CD4+ cells, and this increase persisted after washout, and 1-year after PDG (each symbol represents and individual value). (C) Total T-cells were determined by flow cytometry as CD3+ cells (mean ± SD). (D) The ratio of CD4+ and CD8+ cells was determined by gating from total (CD3+) T-cells (each symbol represents and individual value). n = 7 for panel (A); n = 3–4 subjects/group for panels (B–D). *p ≤ 0.05; **p ≤ 0.01 vs. baseline.

