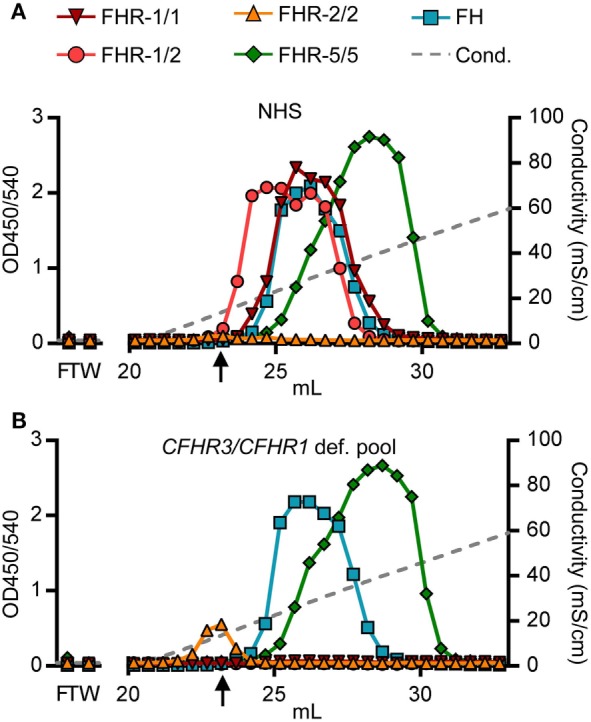
Figure 4.

Heparin elution patterns using untreated sera. Fractions were analyzed by ELISA. (A) Heparin elution pattern of normal human serum (NHS) and (B) pooled CFHR3/CFHR1-deficient serum. Arrow indicates a conductivity of 14.06, representing the physiological salt concentration. Graphs are representative of n = 3. FT, flow through; W, wash.
