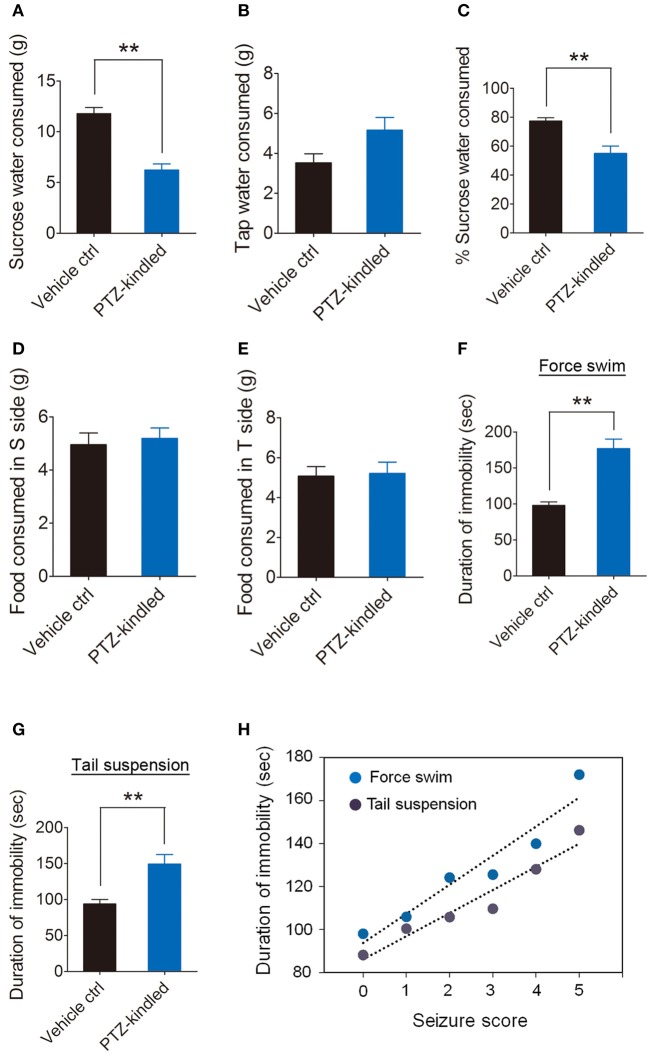
Figure 3.
PTZ kindling-induced depressive-like behavior. (A–E) Bar graphs showing the sucrose water consumed, tap water consumed, percent of sucrose water consumed, food consumed in sucrose (S) side and food consumed in tap water (T) side in vehicle control and PTZ-kindled mice in assessment of depressive-like behavior using the sucrose preference (SP) tests (n = 8). (F–G) Bar graphs showing the immobility time in vehicle control and PTZ-kindled mice in assessment of depressive-like behavior using force swim and tail suspension test (n = 8). (H) Seizure scores of animals during PTZ-kindling development are plotted against immobility time in force swim (p = 0.002, r = 0.94) and tail suspension test (p = 0.003, r = 0.96) (n = 8). Values are means ± S.E.M. **p < 0.01, unpaired two-tailed Student's t-test. The coefficient of correlation (r) is calculated using the Spearman test.

