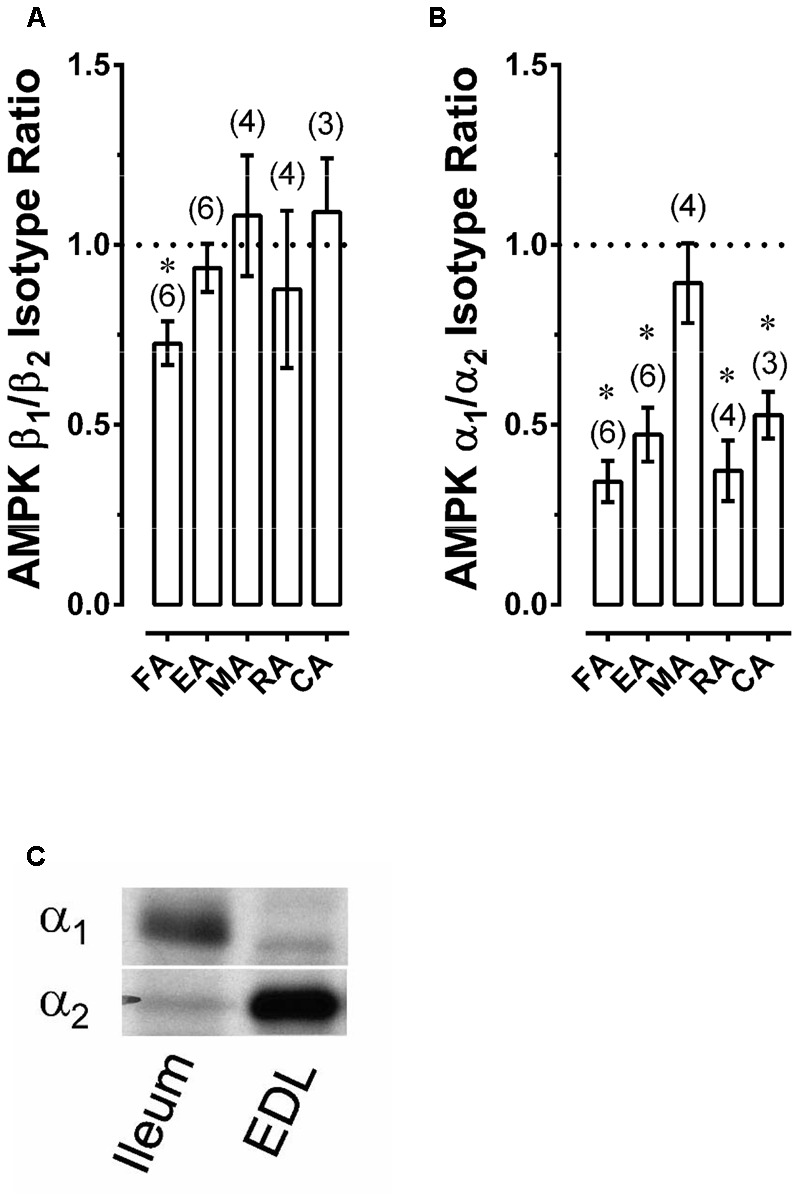
FIGURE 2.

Western blot data revealing AMPK β1/β2 (A) and α1/α2 (B) expression ratios for selected rabbit arteries, as well as an example revealing that use of a Western blot ratiometric α1/α2-AMPK analysis was capable of detecting the expected high α1/α2 ratio in mouse ileum and low α1/α2 ratio in mouse extensor digitorum longus (EDL) (C). Data in (A,B) are means ± SE; n values are in parenthesis; ∗P < 0.05 (one-sample t-test) compared to a ratio of 1.
