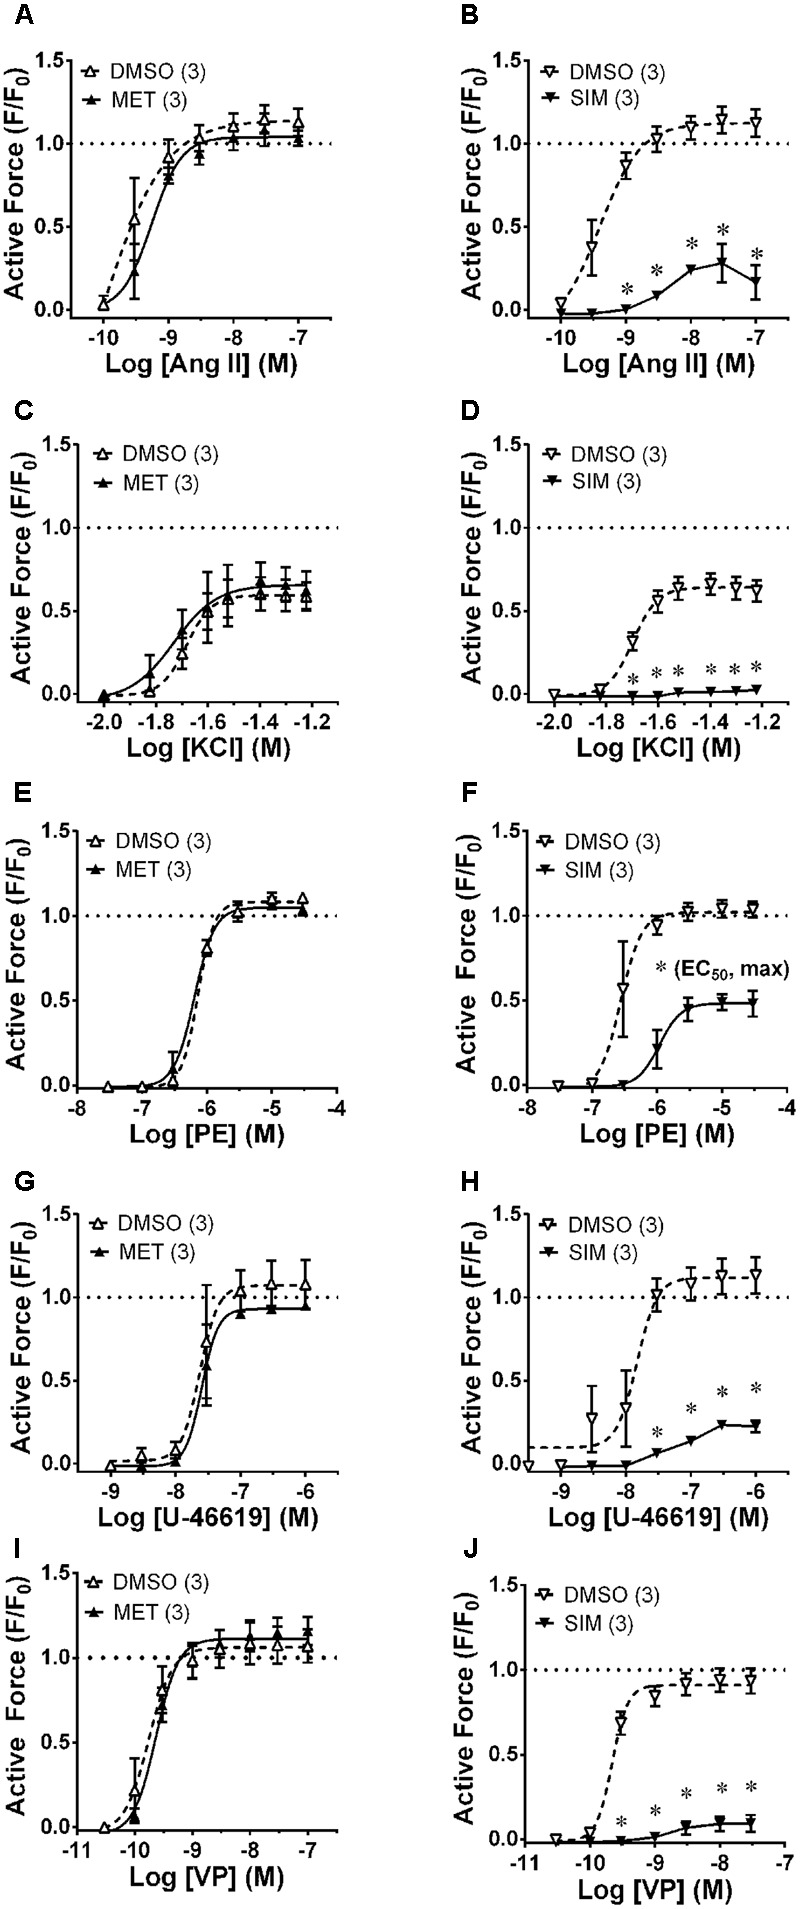
FIGURE 5.

Effects of metformin (MET, 30 μM, first column) and simvastatin (SIM, 30 μM, second column) on CRCs produced by Ang II (first row, A,B), KCl (second row, C,D), PE (third row, E,F), U-46619 (fourth row, G,H) and VP (last row, I,J) in epigastric artery. Data are mean values ± SE; n values are in parentheses. ∗ is P < 0.05 (Student’s t-test) comparing A-769662 and vehicle control (DMSO) data at each agonist concentration and for (F), comparing the identified sigmoidal curve constant for groups SIM and vehicle control (DMSO). EC50, agonist concentration producing ½-maximum contraction. Max, calculated sigmoidal curve maximum tension.
