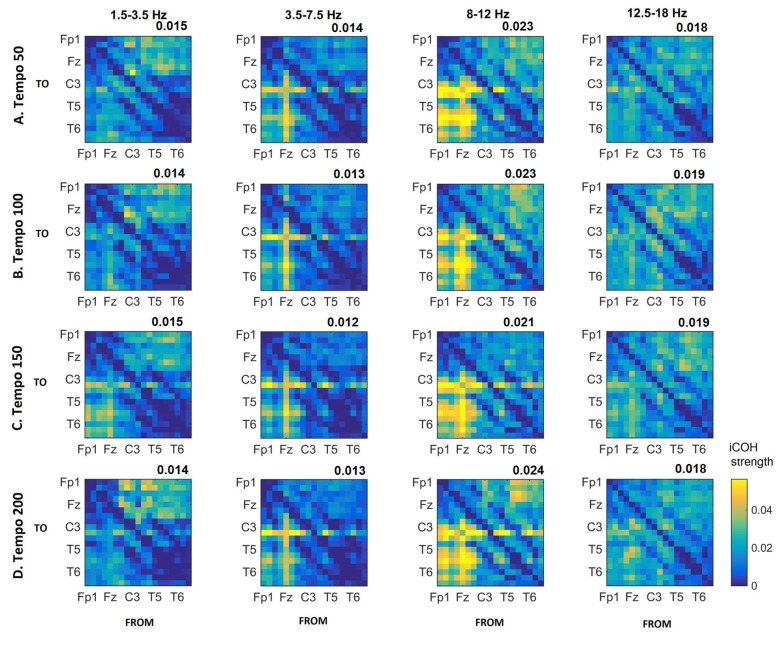
Figure 4.
Group mean iCOH for musical stimuli estimated at different tempi (rows) and frequency ranges (columns). The corresponding mean iCOH over all connections is also shown in the top right corner of each plot. Each matrix represents the iCOH for all electrode pairs for the particular tempo at each frequency range. Matrix columns are sources of information flow (“From”), while rows are sinks (“To”). Channel order for each column/row: Fp1, Fp2, F7, F3, Fz, F4, F8, T3, C3, Cz, C4, T4, T5, P3, Pz, P4, T6, O1 and O2.

