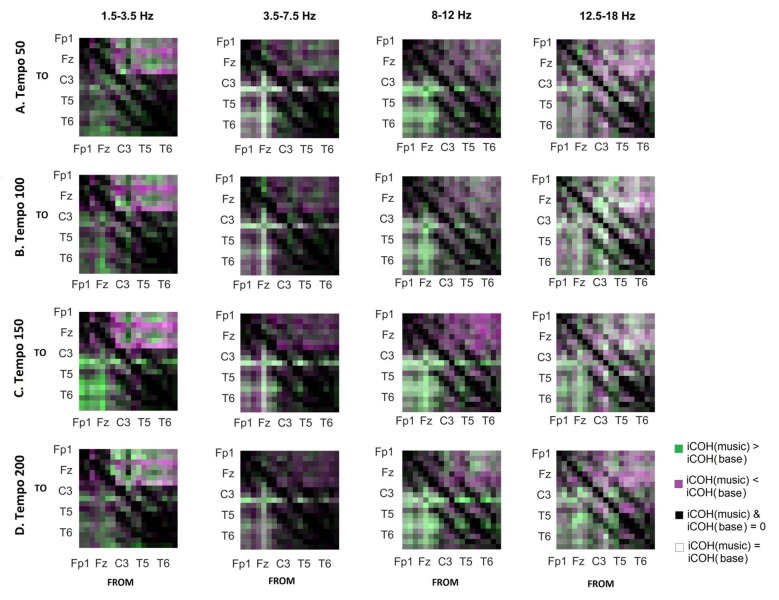
Figure 7.
Contrast between RS and music group mean iCOH. Areas in green indicate stronger iCOH for the music condition, while areas in magenta indicate the opposite. Grayscale indicates areas of similar strength; black: areas where iCOH is zero in both conditions; white: areas where iCOH is equal in both conditions.

