
Figure 3.
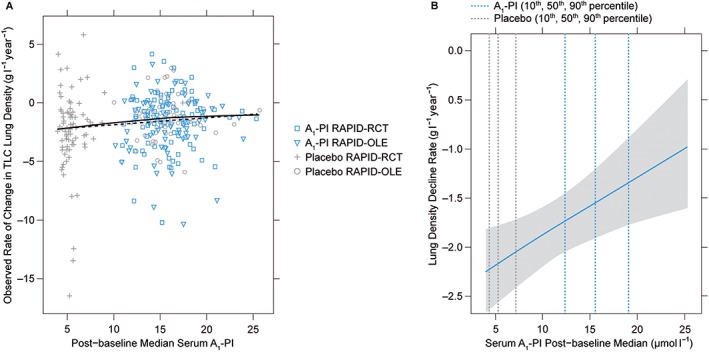
(A) Exploratory visualization to assess parametric form of exposure–response model. Individual data points are based on individual piecewise linear fits. These estimates are nonparametric in the sense that no parametric random effect distribution is assumed and no single model is used to jointly model all data. As such, these slope estimates provide a relatively assumption‐free assessment of model‐fit. Slope estimates and the solid line represents a loess fit to those slope estimates. The dashed line represents model predictions from the final exposure–response model for a hypothetical individual with typical covariate values. (B) Predicted decline rate as a function of exposure. A1‐PI, α‐1 proteinase inhibitor; TLC, total lung capacity