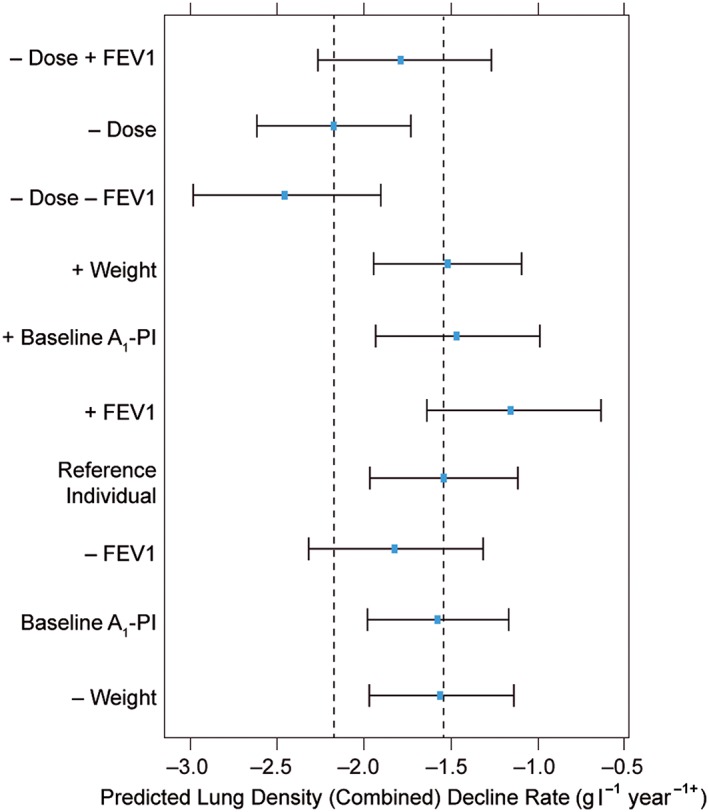
Figure 5.

Predicted decline rate as a function of covariate settings. Study phase effects are not included, i.e., rates reflect conditions seen in the initial RAPID‐RCT phase of the RAPID programme. Point estimates are bootstrap means, and intervals are 95% bootstrap confidence intervals. Dashed vertical lines indicate point estimates (bootstrap means) under reference conditions for placebo (leftmost line) and A1‐PI 60 mg kg–1 week–1 (rightmost line). –/+ covariate indicates the model‐predicted rate of lung density decline in which the covariate has been set to the 10th/90th percentile value, respectively, of a reference individual. A1‐PI, α‐1 proteinase inhibitor; FEV1, forced expiratory volume in 1 s
