
Figure 1.
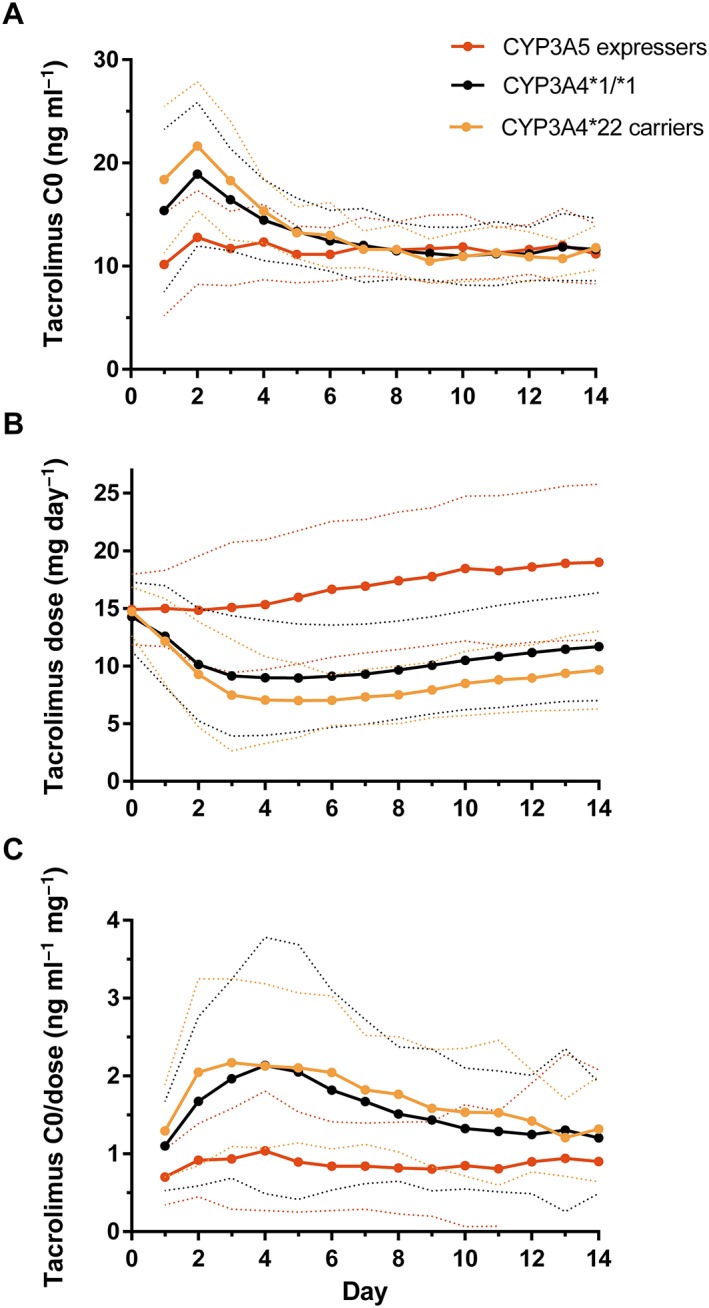
Evolution of tacrolimus C0 (A), dose (B) and C0/dose (C). The solid and dotted lines represent the mean and 95% confidence interval, respectively
Official websites use .gov
A
.gov website belongs to an official
government organization in the United States.
Secure .gov websites use HTTPS
A lock (
) or https:// means you've safely
connected to the .gov website. Share sensitive
information only on official, secure websites.
Evolution of tacrolimus C0 (A), dose (B) and C0/dose (C). The solid and dotted lines represent the mean and 95% confidence interval, respectively