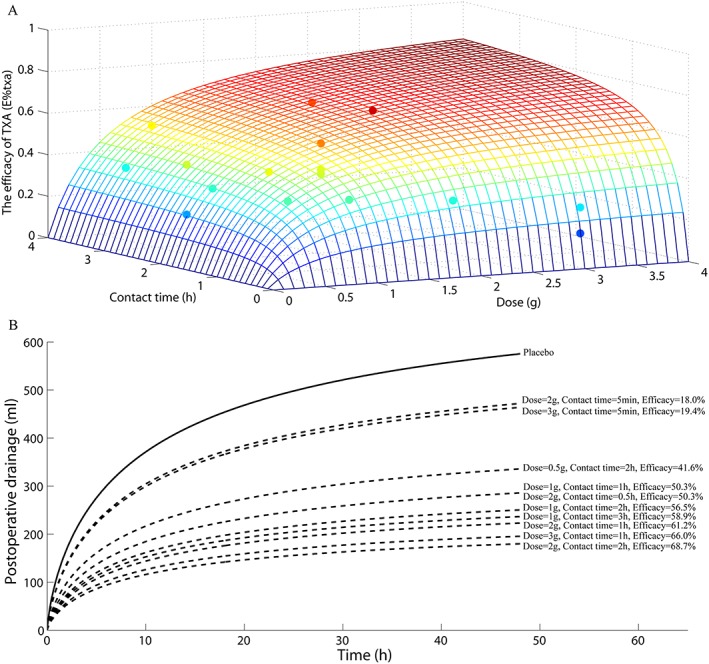
Figure 4.

Influence of the dose and the contact time on the efficacy of tranexamic acid (TXA). (A) Simulation for the TXA efficacy profile changing with TXA dose and contact time. The simulation is according to the equation (5) in the final model and is shown as a wireframe surface with different colours. The surface was further compared with the estimated E%txa,i value in the basic model which were shown as the points with different colours. The colour is determined by the value of z axis (i.e. the efficacy of TXA) and is proportional to it. The surface overlaps the point if there is a coincidence between point and surface with similar colour. (B) Simulation for the postoperative drainage‐time profiles under a series of dosing regimens using the typical parameter value in the final model. The black line is for the placebo group and the black dotted line is for the TXA group. Different dosing regimens and the corresponding efficacy value were marked on the left
