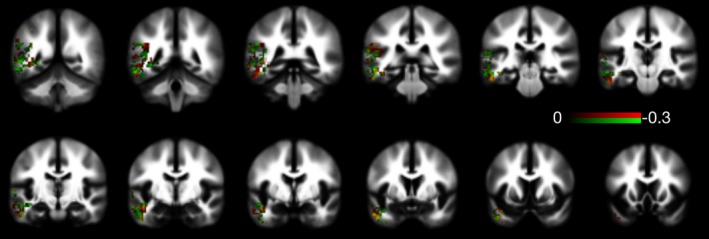
Figure 4.

This mosaic demonstrates which FA and MK voxels most contributed to the classification model. Voxels colored in red were those in which lower values of MK had higher weight toward classifying individuals as belonging to the group of patients. Similarly, the voxels colored in green were those in which lower FA values contributed toward classifying the individuals as patients. The color bar represents the weights, whereas lower negative weights indicated a higher influence in the more towards classification as patients. Finally, voxels colored in yellow (red + green) where those where both the FA and MK values contributed to the classification
