
Figure 2.
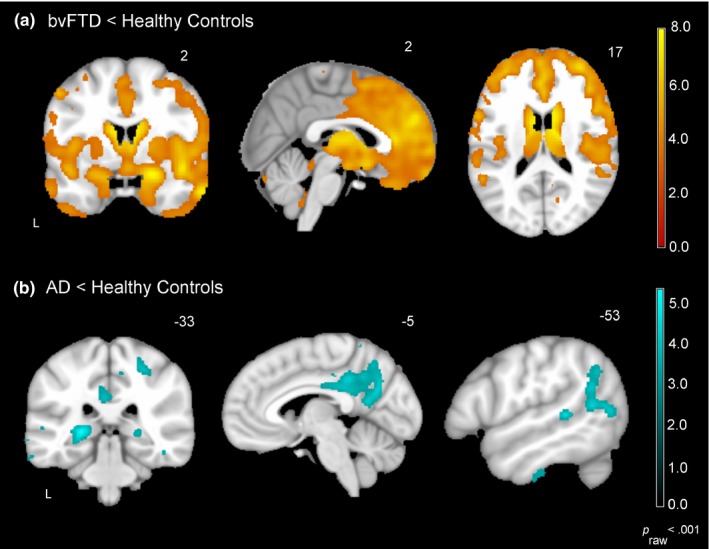
Atrophy patterns in the bvFTD and AD groups. Voxel‐based morphometry analyses (controlling for age, sex, and total intracranial volume) confirmed that each of the diagnostic groups had atrophy patterns that were consistent with their clinical syndrome (p raw < .001). Compared to the healthy controls (N = 28), (a) patients with bvFTD (N = 17) had atrophy in the anterior insula, anterior cingulate cortex, amygdala, thalamus, prefrontal cortex, and orbitofrontal cortex whereas (b) patients with AD (N = 13) had atrophy in posterior cingulate cortex, precuneus, hippocampus, and lateral temporoparietal cortex