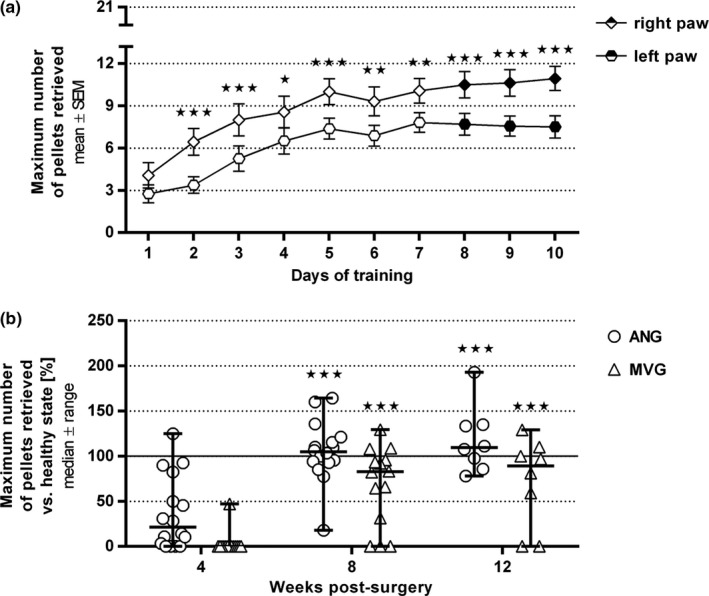
Figure 4.

Quantitative results of the staircase test training phase (a) and its following application to evaluate functional motor recovery by means of fine motor skills over 12 weeks postsurgery (b). (a) During 10 consecutive days of training, paw usage abilities constantly improved leading to a plateau phase (from day 7 onward) in each paw by the end of training (n = 16 paws per group). The last three achievements (indicated by filled symbols) were taken into account to calculate the healthy state mean reference value for each individual paw. Significant paw preference was found in most animals leading to a better performance with the right paw. Two‐way ANOVA followed by Sidak's multiple comparison was applied to examine significant differences (*p < .05, **p < .01, ***p < .001 vs. contralateral paw). Values are given as mean ± SEM. (b) The staircase test was applied to monitor recovery of motivation‐induced fine motor skills and demonstrated a significant increase in both groups over time without significant differences between the groups (autologous nerve graft [ANG]: n = 16 at 4 and 8 weeks postsurgery; MVGs (muscle‐in‐vein grafts): n = 14 paws at 4 and 8 weeks postsurgery, one animal (two paws) had to be excluded due to missing participation during the training phase; ANG and MVG: n = 8 paws at 12 weeks postsurgery). Two‐way ANOVA followed by Tukey's multiple comparison was applied to examine significant differences (***p < .001 vs. 4 weeks postsurgery). Values are displayed as median ± range and given as percentages related to the previously set individual healthy state reference mean values resulting in a healthy state baseline at 100%
