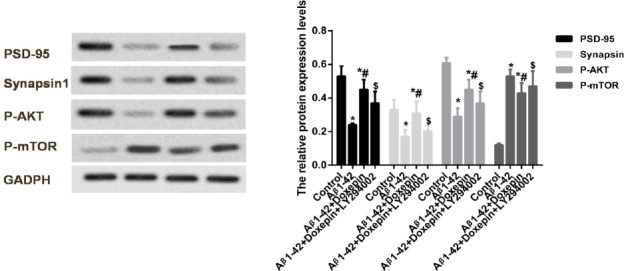
Figure 2.

The protein expression levels of PSD-95, synapsin 1, p-AKT and p-mTOR in SH-SY5Y cells after PI3K inhibitor LY294002 treatment. *P<0.05 compared to the Control group, and #P<0.05 compared to Aβ1-42 group, and $P<0.05 compared to Aβ1-42 + doxepin group. Normal cells (Control group), cells cultured with 5 μM Aβ1-42 (Aβ1-42 group), cells cultured with 5 μM Aβ1-42 and 10 ng/ml doxepin (Aβ1-42 + doxepin group) and cells cultured with 5 μM Aβ1-42 and 10 μM LY294002 (Aβ1-42 + LY294002 group)
