
Figure 1.
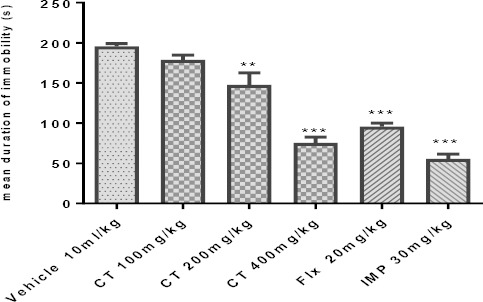
Effect of IP administration of hydroethanolic extract of Carthamus tinctorius (CT) in TST. Values are presented as mean± SEM. ** and *** show significant differences between vehicle (control) and other groups at P<0. 01 and P<0.001, respectively. Significance level was analyzed by one-way ANOVA followed by Tukey’s test