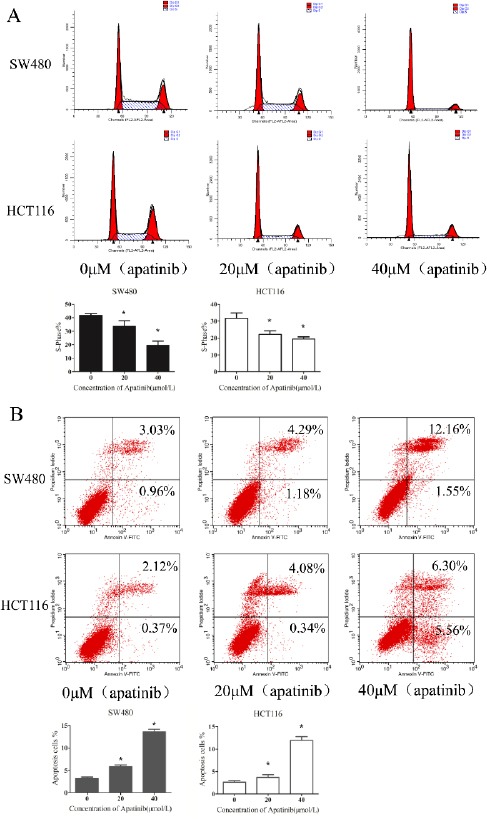
Figure 2.

Apatinib dose-dependently promoted cell cycle arrest and induced cell apoptosis.
(a)After cells treated with apatinib (0, 20, 40 μM, respectively) for 24 hr, the cells were stained with Annexin V-FITC/PI and determined by FASC analysis. The percentage of apoptotic cell numbers is shown. (b) The distribution of the cell cycle of HCT116 and SW480 cells were determined by flow cytometry after treating with apatinib (0, 20, 40 μM, respectively) for 24 hr. The percentage of S—phase is shown. * represents P<0.05
