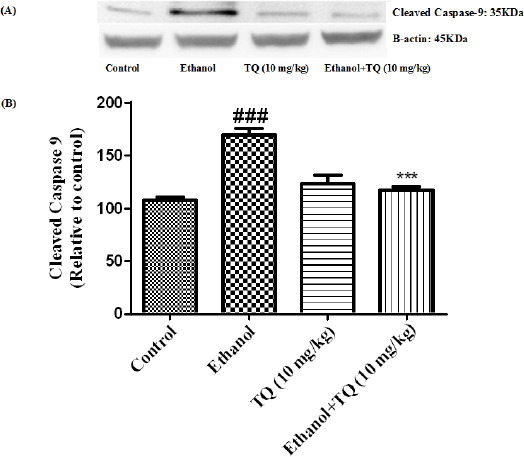
Figure 13.

Effect of TQ (10 mg/kg) and ethanol on the protein level of caspase-9 (cleaved caspase-9) in the rat liver tissue. (A) Representative Western blots showing specific bands for cleaved caspase-9 (35 KDa) and β-actin as an internal control. Equal amounts of protein sample (50 μg) obtained from whole liver homogenate were applied in each lane. (B) Densitometric data of protein analysis. Data are expressed as the mean±SEM. *** P< 0.001 vs ethanol treated group, ### P<0.001 vs control group
