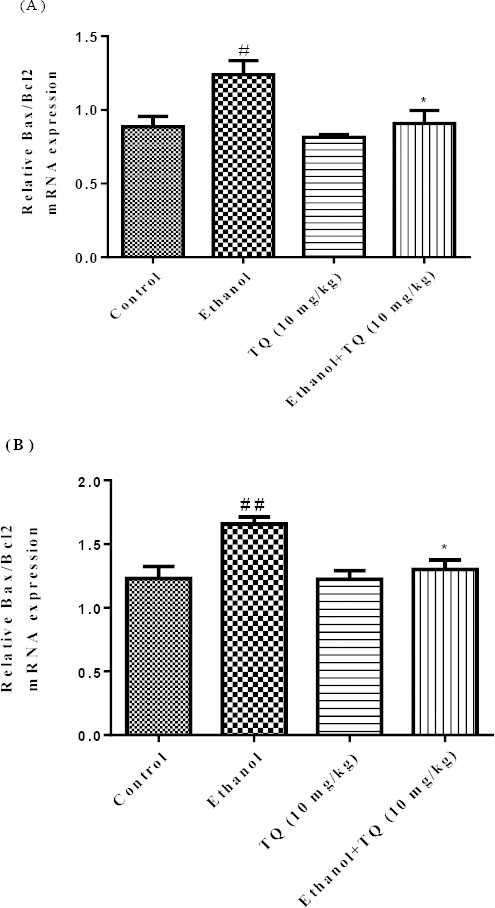
Figure 15.

Effect of ethanol and TQ (10 mg/kg) on Bax/Bcl-2 mRNA expression in the rat liver (A) and kidney (B) after 4 weeks treatment by real time PCR. The transcript level of each sample was normalized against β-actin transcript level. Data are expressed as the mean±SEM. * P<0.05 vs ethanol treated group and ## P< 0.01 or # P< 0.05 vs control group
