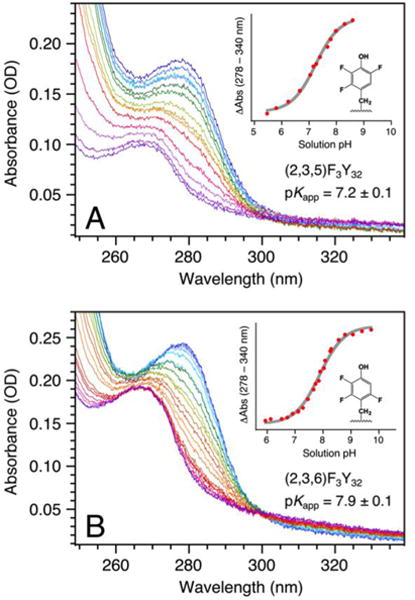
Figure 2.

UV-Vis spectra and corresponding pH-titration curves for (A) α3(2,3,5)F3Y and (B) α3(2,3,6)F3Y. The α3(2,3,5)F3Y spectra were incrementally collected from pH 8.59 (dark blue) to pH 5.46 (dark purple) and back to pH 7.04 (red); while the α3(2,3,6)F3Y spectra were collected from pH 9.72 (dark blue)to pH 5.94 (dark purple) and back to pH 7.11 (red). The titration plots were fit to a single pKa.
