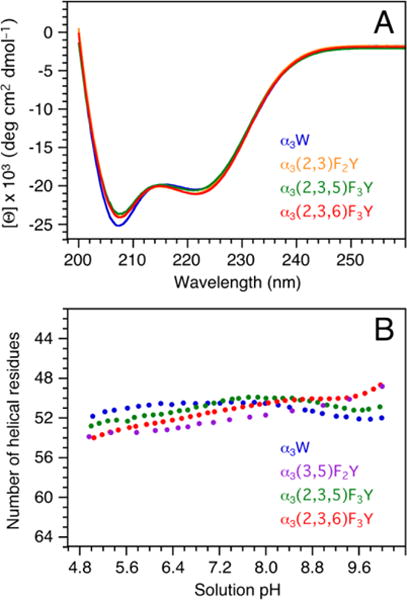
Figure 3.

(A) Far-UV CD spectra of α3(2,3,5)F3Y (green), α3(2,3)F2Y (orange), α3(2,3,6)F3Y (red), and α3W (blue; reference spectrum). The proteins were dissolved in 40 mM sodium acetate and the final sample pH measured to 5.05 ± 0.01. The spectra are displayed in units of mean residue molar ellipticity ([Θ]) obtained by: [Θ] = θobs106/Cln where θobs is the observed ellipticity in millidegrees, C the protein concentration in μM, l the cuvette path length in mm (2), and n the number of amino-acid residues (65). C was determined using a fluorescence-based assay (SI). (B) pH-induced changes in the α-helical contents of α3(3,5)F2Y (purple; reproduced from Ref. 30), α3(2,3,5)F3Y (green), α3(2,3,6)F3Y (red) and α3W (blue; reference data25,27).
