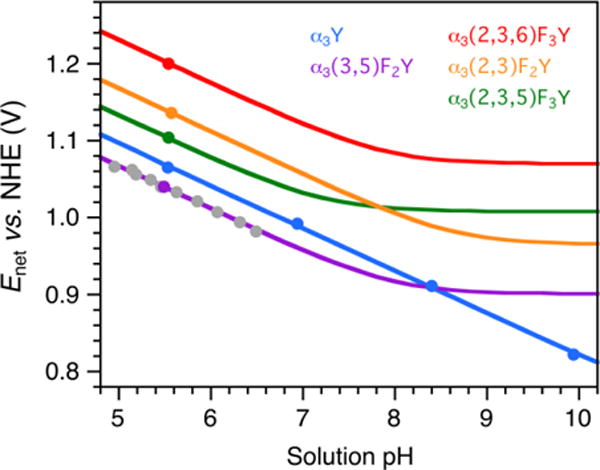
Figure 5.

Enet vs. pH diagrams for α3Y and the α3FnY proteins. Solid dots represent Enet values obtained by PFV. Grey dots represent Enet collected from α3(3,5)F2Y using the following conditions: 70 μM protein, 20 mM APB, 75 mM KCl; pH adjusted with 1 M NaOH; step potential 0.15 mV, SW pulse amplitude 25 mV, SW frequency 190 Hz, and temperature 25 °C.
