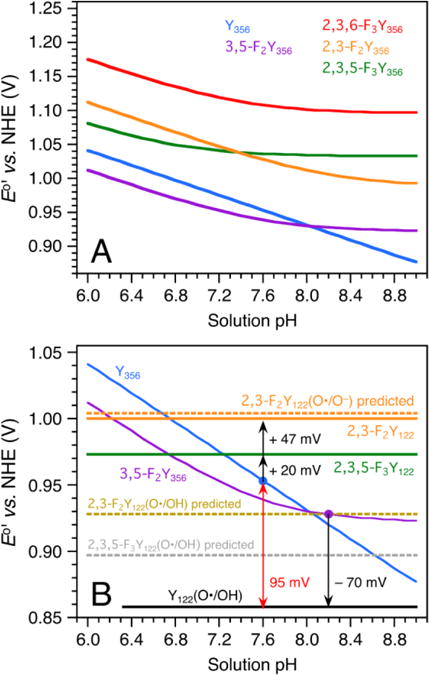
Figure 8.

Thermodynamic model for sites Y122 and Y356 in wt and FnY-RNR. (A) Predicted E°′ vs. pH diagrams for residue Y356 in the wt RNR and in mutants containing FnY356 (n = 2, 3) residues. Y356 is modeled with a pKa of 10.4, which makes Y356(O•/OH) the dominant redox couple across the displayed pH range. The FnY356 residues are modeled with lower pKa’s (3,5-F2 7.6; 2,3,5-F3 6.8; 2,3-F2 8.2; 2,3,6-F3 7.4) and their potentials are described by a pH-weighted mixture of the FnY356(O•/OH) and FnY356(O•/O−) redox pairs. (B) Modeled E°’s for residue Y122 in the wt and FnY122-RNRs. The Y356 (blue) and 3,5-F2Y356 (purple) E°′ vs. pH diagrams are superimposed from Panel A. The black arrows represent experimentally obtained ΔE°’s (Figures S8 and S9).63 A +95 mV step is predicted for RT from Y122(O•/OH) to Y356 (O•/OH) in wt RNR (red double arrow). The E°’s are modeled for 25 °C.
