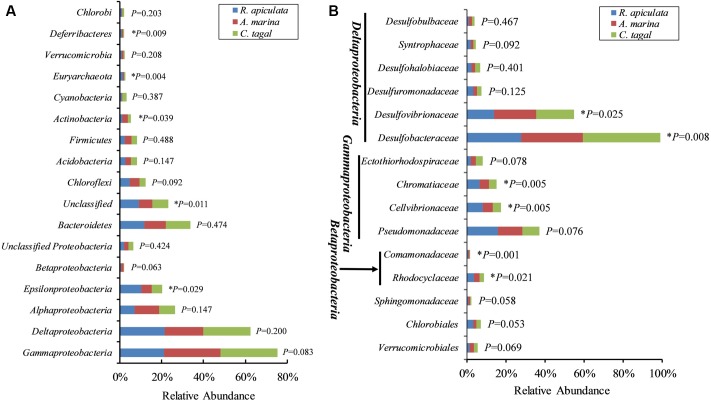
FIGURE 4.
Relative abundance of the most abundant 16S rRNA and nifH gene groups. (A) The dominant 16S rRNA gene groups were categorized at the phylum level, except for the Proteobacteria, which were categorized by class. (B) The dominant nifH gene groups were classified to the family level. Asterisks (∗) represent significant differences among sediments of the three mangrove species (P < 0.05).

