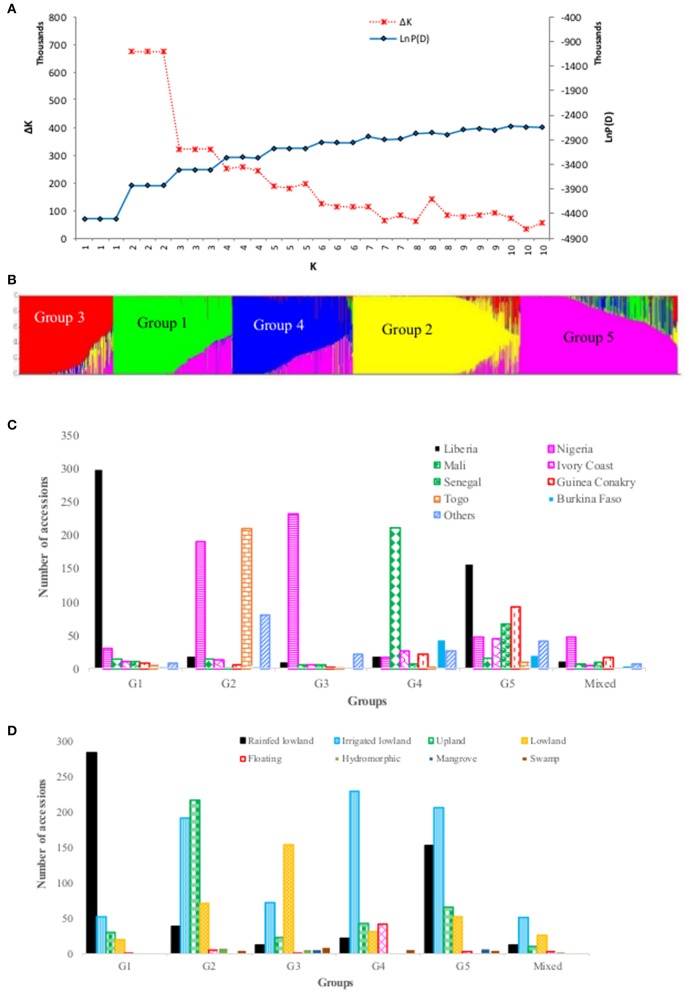
Figure 3.
Population structure of 2,179 accessions based on 3,834 polymorphic SNPs: (A) plot of LnP(D) and an ad hoc statistic ΔK calculated for K ranging from 1 to 10, with each K repeated thrice; (B) population structure at K = 5, with each accession represented by a single vertical line that is partitioned into K colored segments, with lengths proportional to the estimated probability membership value (y-axis); (C) frequency distribution of accessions belonging to each predicted group by country of origin, with all countries that had <40 accessions combined in to “others”; (D) frequency distribution of accessions belong to each predicted group by ecology, with “others' referring to accessions from floating, mangrove, deep and shallow forest swamp, and hydromorphic ecologies. See Supplementary Table S1 for details.

