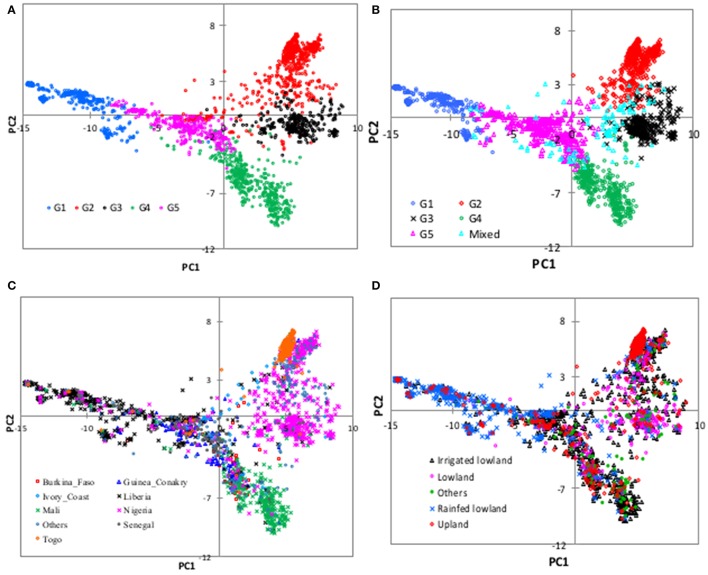
Figure 4.
Plots of PC1 (14.6% of variation) and PC2 (5.8%) from principal component analyses of 2,179 O. glaberrima accessions genotyped with 3,834 polymorphic SNPs. The plots are based on group membership from (A) cluster analysis, (B) STRUCTURE at K = 5, (C) country of origin, and (D) ecology. All countries with < 40 accessions were combined to “others.” In the ecology plot, “others” refers to accessions from floating, mangrove, deep and shallow forest swamp, and hydromorphic ecologies, each with smaller number of accessions. See Supplementary Table S1 for details.

