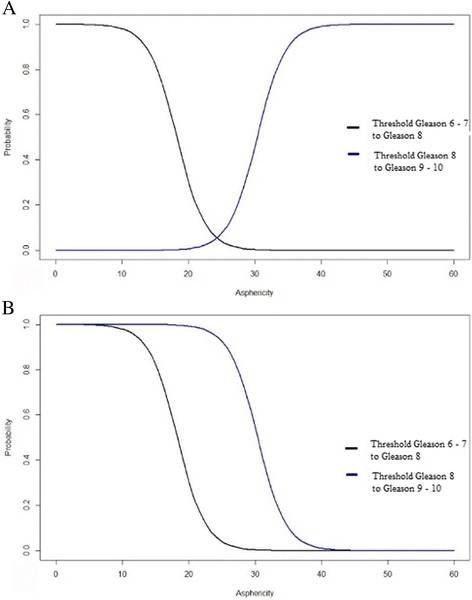
Fig. 4.

Probabilities of a Gleason score for different asphericity values. a The chart plot demonstrates the relative probability for the differentiation between prostate cancer lesions with Gleason score 6–7 and 8 as well as Gleason score 8 and 9–10. The area left of the black curve indicates the probability of Gleason 6–7, the area between black and blue curves indicate the probability of an ASP being scored Gleason 8 and the area to the right of the blue curve indicate the probability for Gleason 9–10. b The lower chart demonstrates cumulative probabilities of a Gleason score subgroup based on an ASP value containing the same areas beside the curves as described above
