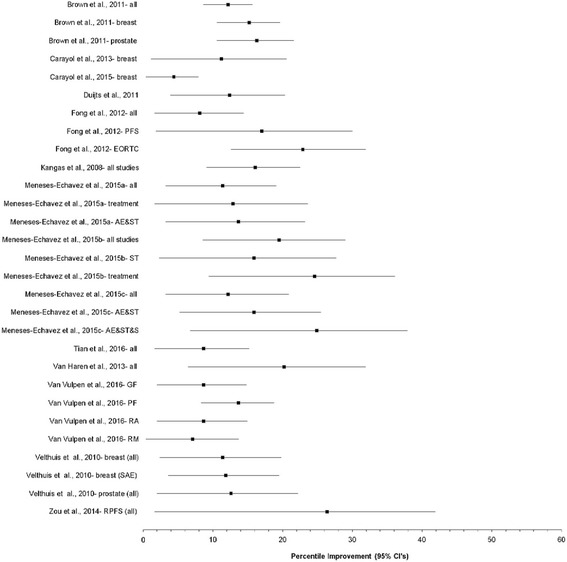
Fig. 5.

Forest plot for percentile improvements in fatigue. The black squares represent the pooled percentile improvement for each analysis while the left and right extremes of the squares represent the corresponding 95% confidence intervals for percentile improvement for each analysis. Values were derived from the pooled standardized mean difference (SMD) effect size for each meta-analysis and based on a random-effects model in which results were statistically significant (p ≤ 0.05) with non-overlapping 95% confidence intervals. Results were not pooled across all analyses because some of the results included the same studies. AE&ST&S, Aerobic exercise, strength training and stretching; AE&ST, Aerobic exercise and strength training; EORTC, European Organization for Research and Treatment of Cancer; GF, General fatigue; PF, Physical fatigue; PFS, Piper Fatigue Scale; RA, Reduced activity; RM, reduced motivation; SAE, Supervised aerobic exercise; ST, Strength training
