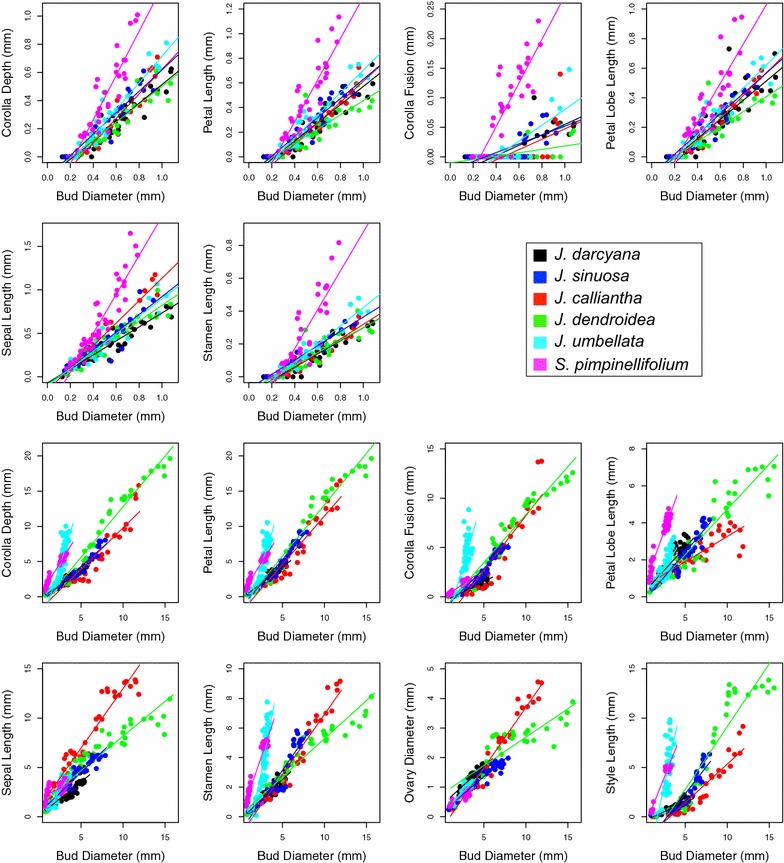
Fig. 8.

Growth trajectories for the focal floral organs and features. For all panels, the x-axis is bud diameter (mm) and the y-axis is the focal organ (mm). Top: growth rates during early stages (bud measurements during “stages A–F”); and bottom: growth rates during mid- and late stages (bud measurements during “stages G–I”). Data points as well as regression lines of best fit are color coded by species. Slopes on log-transformed values are presented in Table 4 and Additional file 1: Table S3
