
Fig. 4.
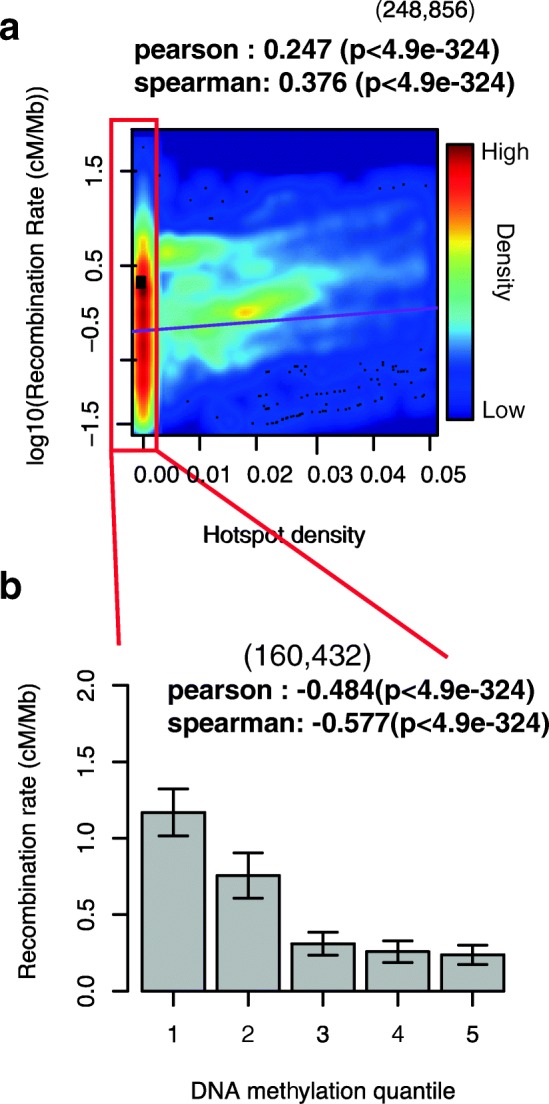
Recombination rate valleys are correlated with hotspot density and DNA methylation. a The relationship between log10(recombination rate) and recombination hotspot density (per kb) at each eQTL interval. Heat colors represent the point density. Recombination hotspot density less than 0.005/kb (red rectangle) was extracted for the analysis in b. b The relationship between average recombination rate and DNA methylation quantiles in GV oocyte stage within eQTL intervals. Error bars indicate the standard deviation