Fig. 1.

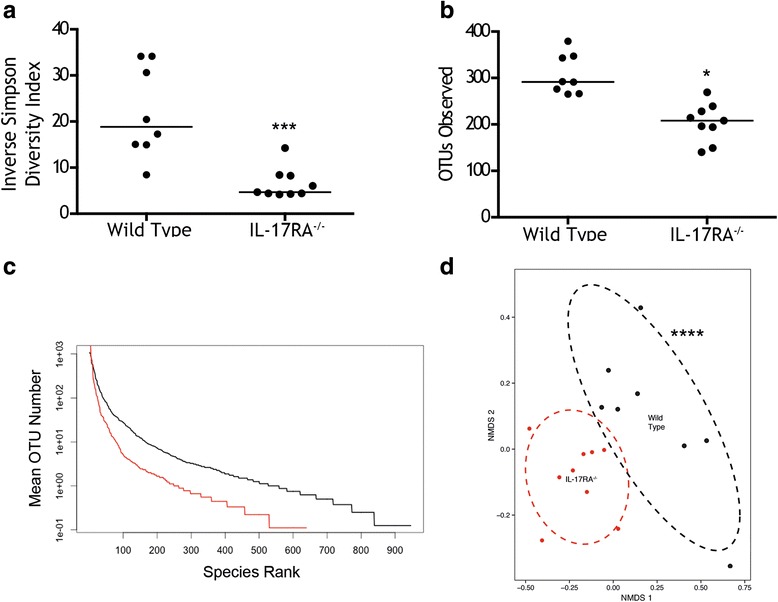
Analysis of resting microbiome of wild type and Il17ra KO mice. a Inverse Simpson Diversity Index and (b) number of observed OTUs between wild type and Il17ra KO mice (IL-17-/-). Each symbol is the result from an individual animal. Horizontal line denotes median. Significant differences between the groups are shown: ***, p < 0.001, * p < 0.05, Mann-Whitney test. c Rank abundance curves for the observed OTUs of WT (black) and Il17Ra knockout mice (red). d Non-metric multidimensional analysis with ellipses representing 80% confidence limit for each group. Differences between the groups were significant (***. P < 0.0001, using PERMANOVA)
