
Fig. 2.
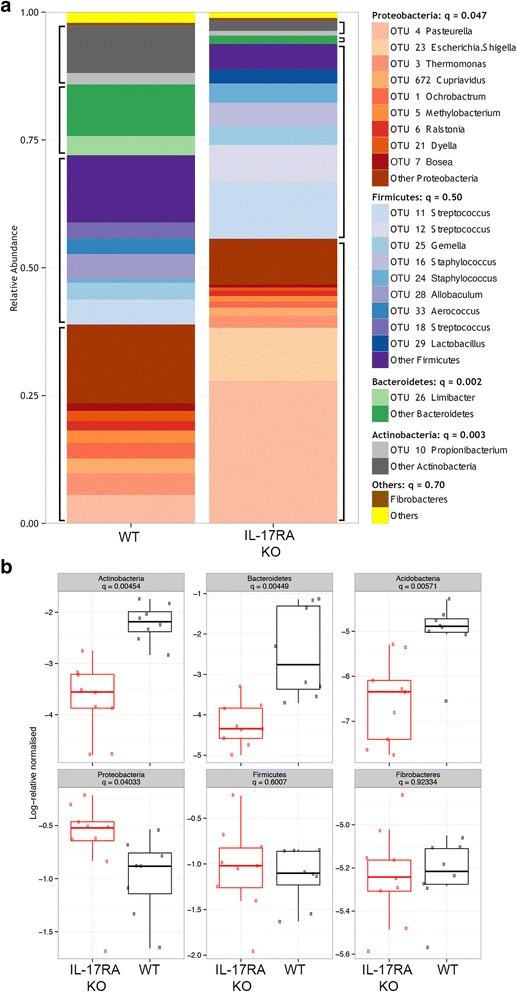
Analysis of resting wild type and Il17ra KO microbiome. a The 20 most abundant OTUs from the resting dataset are plotted individually with the remainder combined. Data are pooled from several mice (n = 8-9/group) and blocks of similar colours represent common bacterial phyla. Significance testing using Kruksal-Wallis test corrected for multiple comparisons is shown in the legend. q value represents outcome of testing for difference in abundance of major phyla between wild type and Il17ra KO mice. b Plots showing log normalised relative abundance of the 6 most abundant bacterial phyla. Points are individual animals. Box encloses the interquartile range, line is the median and the whiskers extend to 1.5 x above and below the interquartile range