
Fig. 4.
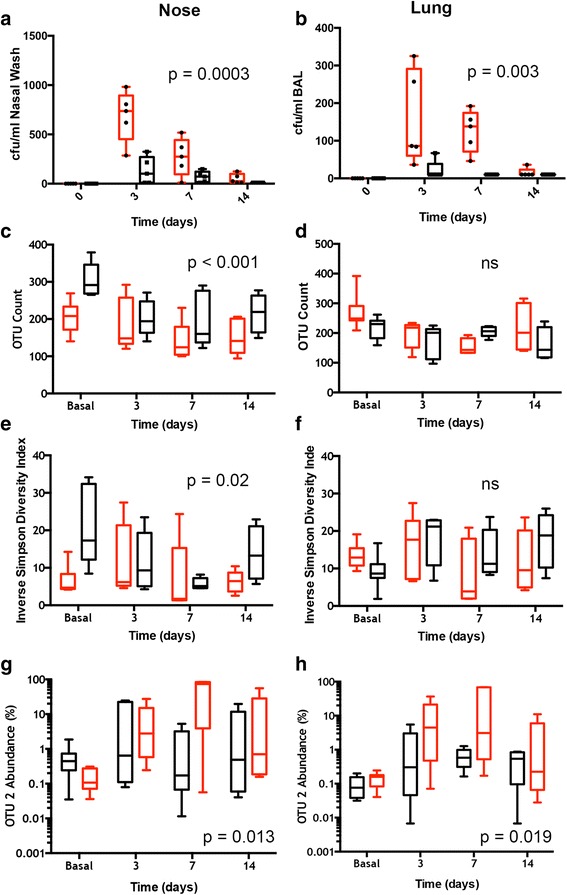
Comparison of nose and lung microbiome following Pneumococcal Inoculation. a Nasal and (b) lung colonisation with Streptococcus pneumoniae assessed by routine culture methods. Differences between the groups were significant, 2-way ANOVA, (a, p=0.0003, b, p=0.003). Nose (c, e and g) and lung (d, f and i) microbiomes compared for OTU count (c and d), Diversity (e and f) and OTU2 abundance (g and h). Symbols for box and whisker plots as in Fig. 1. P values are for 2-way ANOVA between the wild type and Il17ra KO animal groups. ns = not significant