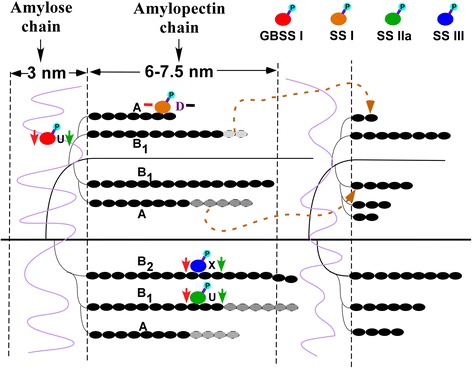
Fig. 8.

Schematic representation of amylose and amylopectin synthesis in the endosperm. Proteins with reduced levels under drought stress are indicated by the letter D. Proteins with increased levels under drought stress are indicated by the letter U. Proteins not detected in this study are indicated by the letter X. Down arrows (on the right with green colour) indicate that the phosphorylation levels were reduced under drought stress. The horizontal line indicates that the phosphorylation levels did not change under drought stress. Down arrows (on the left with red colour) indicate that the transcription level of these phosphoproteins were reduced under drought stress and the horizontal line (on the left with red colour) indicates that the transcription levels did not change under drought stress. Phosphoproteins are indicated by a lowercase letter p
