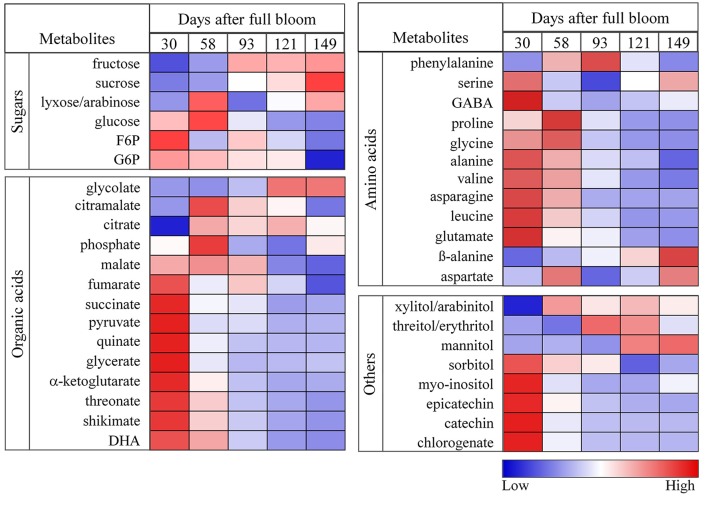
Figure 5.
Heat maps showing the changes in the concentrations of sugars, organic acids, amino acids, sugar alcohols, and polyphenols during fruit growth (30, 58, 93, 121, and 149 days after full bloom). The deep blue color (low) denoted lower concentration of metabolites whereas the deep red color (high) denoted higher concentration of metabolites. The colors were generated from GC-MS metabolite profiling raw data (relative value) using the MultiExperiment Viewer software (MeV v4.9.0) after mean center and scale transformation into comparable levels.

