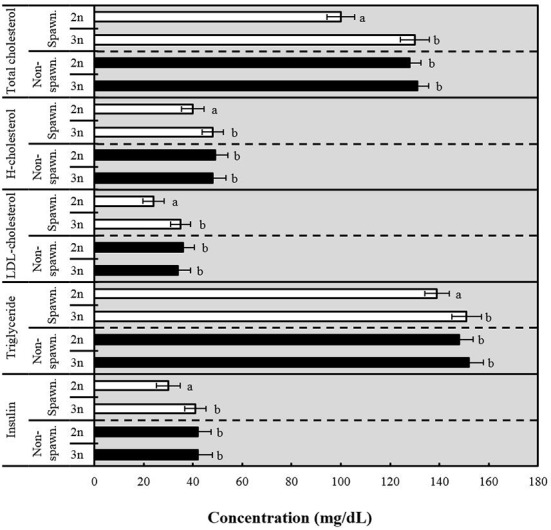
Fig. 4. Comparative analysis of total cholesterol, high cholesterol (H-cholesterol), low density lipoprotein cholesterol (LDL-cholesterol), triglyceride and insulin concentrations between diploid (2n) and induced triploid (3n) Far Eastern catfish, Silurus asotus in spawning (May) and non-spawning season (January) at 2016.

The values of horizontal bars are means ± SD (n=30) in each group. Different letters on error bars are significantly different for each group (P<0.05).
